Plot facade — grammar of graphics
Plot is the ergonomic front door for cartesian / polar /
heatmap chart families. Build a chart by composing data + a mark
- encodings:
#![allow(unused)]
fn main() {
use wisp_chart::plot::{self, DataFrame, Mark, Plot, ScaleKind, Value};

let plot = Plot::new(df)
    .mark(Mark::Bar { value_labels: false })
    .encode(plot::x("quarter", ScaleKind::Band))
    .encode(plot::y("revenue", ScaleKind::Linear))
    .encode(plot::color("region"));
let graphics = plot.render(&theme, viewport_px);
}
That's the entire surface. Swap Mark::Bar for Mark::Line (when
it ships) and the same data + encodings render as a line chart.
Pieces
graph LR
    R[user rows] -->|from_rows + flatten| DF[DataFrame<br/>column-oriented]
    DF -->|encode| ENC[Encoding<br/>X / Y / Color]
    ENC -->|scale_kind| SK[ScaleKind<br/>Linear / Band / Ordinal / Time / Log]
    ENC --> P[Plot]
    M[Mark<br/>Bar / Line / Area / ...] --> P
    T[Theme] --> P
    P -->|render| G[wisp::Graphics]
    classDef data fill:#7c2d12,stroke:#ea580c,color:#fed7aa
    classDef api fill:#1e293b,stroke:#475569,color:#cbd5e1
    classDef out fill:#14532d,stroke:#16a34a,color:#bbf7d0
    class R,DF data
    class ENC,SK,M,T,P api
    class G out
DataFrame
User rows of any R type are flattened once via a closure into a
column-oriented DataFrame. Each column is either
Value::Number(f32) (feeds Linear / Log / Y scales) or
Value::Category(String) (feeds Band / Ordinal / Color
encodings). After the flatten, every encoding refers to columns
by name.
#![allow(unused)]
fn main() {
struct Sale { quarter: String, revenue: f32, region: String }
let df = DataFrame::from_rows(&rows, |s| vec![
    ("quarter".into(), Value::Category(s.quarter.clone())),
    ("revenue".into(), Value::Number(s.revenue)),
    ("region".into(),  Value::Category(s.region.clone())),
]);
}
Trade-off: pay an O(n × cols) flatten cost on construction, gain string-based encoding ergonomics + automatic scale-derivation from column values.
Mark
Mark is the drawable shape a Plot emits per row. v1 ships:
Mark::Bar { value_labels: bool }— rectangular bar, one per row.value_labelstoggle is parsed but not rendered yet (lands when the axis renderer arrives).
Follow-on tickets add Line, Area, Point, Cell, Box,
Candlestick, Polygon, Arc — each is one variant on this
enum + one renderer arm in Plot::render. The facade surface
stays stable.
Encoding
An Encoding wires one Channel (X / Y /
Color) to one DataFrame column with a chosen
ScaleKind. Convenience constructors:
| Helper | Channel | Default scale |
|---|---|---|
plot::x(field, scale_kind) | X | as specified |
plot::y(field, scale_kind) | Y | as specified |
plot::color(field) | Color | Ordinal |
Domain auto-derives from the column values:
Linearreadsnumeric_extent(column min/max).Band/Ordinalreaddistinct_categories(in insertion order).- Override the numeric domain explicitly with
.domain((lo, hi))on theEncoding.
The Color encoding is stored on the Plot but Mark::Bar v1
ignores it — single-color bars only. When Mark::Bar is
upgraded to multi-series (M-CHART.7 Grouped Bar / M-CHART.8
Stacked Bar) the Color encoding wires into palette lookup.
Single-series charts get their colour from theme.palette via
the X category hash.
What's deferred to the v1 follow-ups
This Plot facade is layout-stable but visually minimal for
v1. The chart-side TODOs that share this same render path:
- Axis renderer (AUT-183 / M-CHART.3) — emits tick lines + tick labels + axis titles. The plot area today reserves the gutter / header / footer pixels so axes can drop in without shifting bars.
- Legend renderer (AUT-184 / M-CHART.4) — colour swatches + labels for multi-series charts.
- Value labels on bars — currently inert (
Mark::Barcarries the flag).
All three land as commits that extend Plot::render without
changing the public API.
Verified by
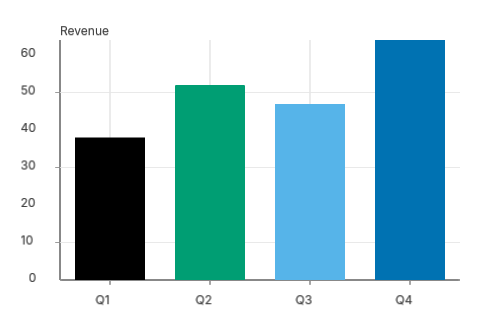
crates/wisp-chart/src/plot/*.rs— 13 unit tests covering DataFrame construction, distinct-category de-dup, numeric extent, encoding chain, channel replacement, NDC conversion, background-only fallback when encodings are missing.crates/wisp-chart-web/tests/render_bar.rs— integration test: builds a 4-quarter DataFrame, runs the fullPlot::new → mark → encode → renderchain, renders viawisp::Rendererto an offscreenRgba8Unormtexture, and asserts (1) header area is white, (2) the tallest bar's centre pixel is non-white. Also regenerates thebar-quarterly.pngsnapshot above.
What this unblocks
Every cartesian / polar / heatmap chart now has a stable surface to land against. The chart wave can proceed in parallel:
- M-CHART.6 Bar variants (grouped / stacked / 100%): add
encodings (
XOffset,Stacktransform). - M-CHART.9 Line, M-CHART.10 Area, M-CHART.11 Scatter, M-CHART.12
Bubble, M-CHART.13 Connected scatter: add
Markvariants + renderer arms. - M-CHART.20+ statistical charts: add
Transformenum (Bin,Density,Stack,RunningTotal) that runs before marks emit.