Axes
Axes are the gridlines, tick marks, tick labels, and axis titles
that frame a cartesian plot. The Plot facade emits them
automatically; this chapter documents the renderer behind that
default + the knobs the caller has.
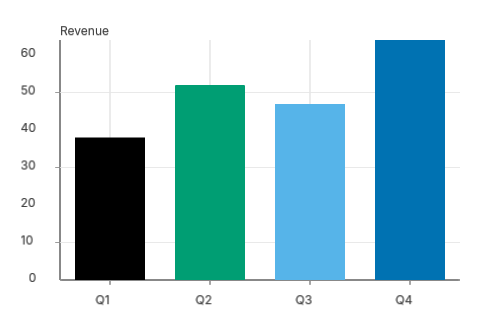
What ships with the default render
A Plot rendered with default settings emits, in this order:
background → Y gridlines + Y axis line + Y tick marks →
X gridlines + X axis line + X tick marks → marks (bars, lines)
→ tick labels + axis title.
The order matters: gridlines + tick marks emit BEFORE marks so data primitives composite on top of the grid. Tick labels emit AFTER marks so they are never occluded by a tall bar.
Public surface
The renderer's primitives live in wisp_chart::axis.
Two pairs of functions, one pair per axis direction:
| Function | Returns | Purpose |
|---|---|---|
emit_x_axis_lines | wisp::Graphics | Bottom/top axis line + ticks + grid |
emit_y_axis_lines | wisp::Graphics | Left/right axis line + ticks + grid |
emit_x_axis_text | Vec<wisp::Text> | Tick labels + X-axis title |
emit_y_axis_text | Vec<wisp::Text> | Tick labels + Y-axis title (rotated -π/2) |
The lines/text split exists because wisp::Graphics and
wisp::Text are different node types — Graphics is composable
via Graphics::append,
Text needs a Font instance.
Why Plot needs axis_text_labels separately
Plot::render returns a single Graphics subtree. It cannot
emit Text nodes because text rendering needs a wisp::Font,
which depends on a live wgpu device. To keep wisp-chart's
public API device-free, the caller supplies the font:
let plot = Plot::new(df)
    .x_title("Quarter")
    .y_title("Revenue")
    .encode(plot::x("quarter", ScaleKind::Band))
    .encode(plot::y("revenue", ScaleKind::Linear));

// Marks + axis lines:
let graphics = plot.render(&theme, viewport);
let root = stage.root();
let _ = stage.add_child(root, graphics);

// Axis text — needs the Font:
let font = Font::bitmap_8x8(&app);
for text in plot.axis_text_labels(&theme, viewport, &font) {
    let _ = stage.add_child(root, text);
}
Disabling axes
For minimalist renders (sparklines, design previews), call
.axes(false) to skip every axis primitive. Useful when the
chart is embedded inside a card UI and the parent component
draws its own framing.
let plot = Plot::new(df).axes(false).mark(Mark::Bar { value_labels: false });Coordinate convention
The axis renderer takes pixel-space tick positions (top-left
origin, +Y down) and emits NDC primitives (+Y up). This
matches wisp's convention; wisp::math::Rect doc says +Y
down in source code but the renderer flips. Always think in
pixels in the chart layer; the conversion happens inside
emit_*_axis_*.