Chart gallery
Every chart wisp-chart can render in one place. Click a
thumbnail to open the chapter; the live WebGPU demos are
embedded inside each.
Cartesian marks
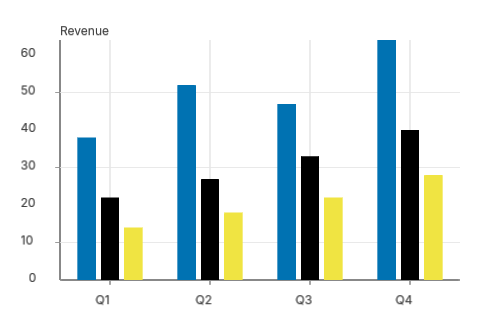
Grouped bar
Side-by-side comparison per X band
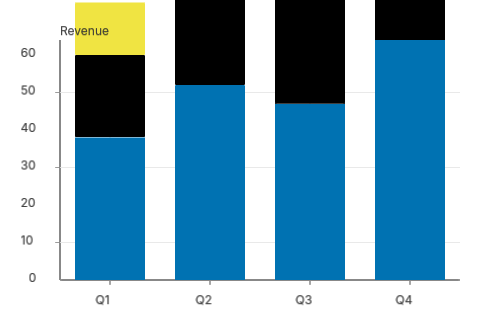
Stacked bar
Composition within a total
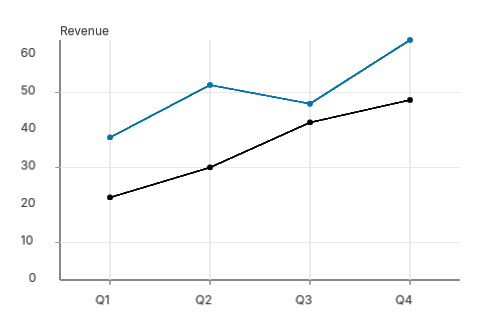
Line
Time-series + multi-series
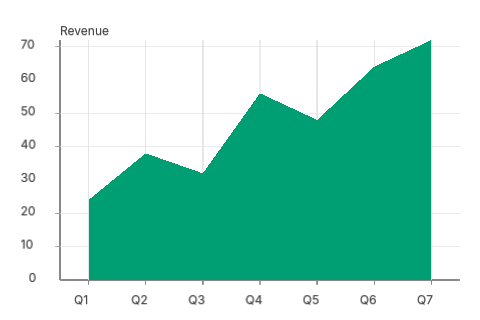
Area
Filled region under a curve
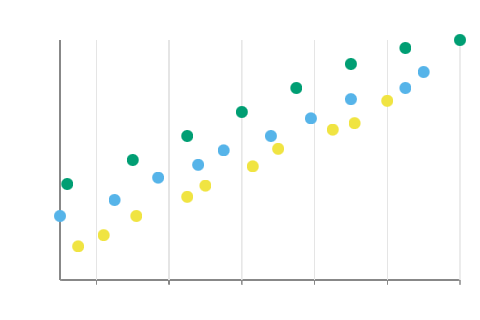
Scatter
Continuous-x point cloud
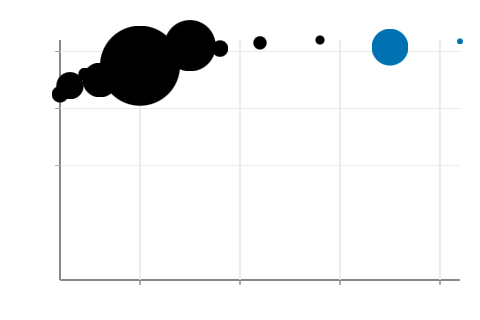
Bubble
Scatter + area-encoded size
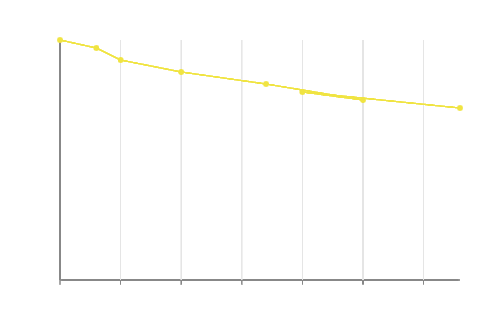
Connected scatter
Trajectory through 2D space
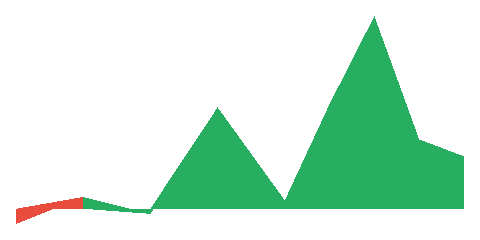
Baseline
Area split above/below a threshold
Indicators
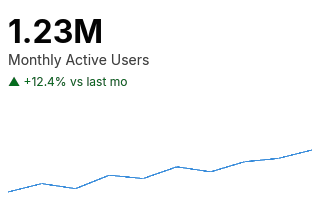
KPI card
Big number + delta + sparkline
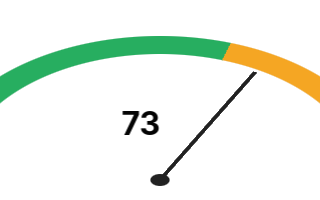
Gauge
Semicircle + threshold zones

Bullet
Performance vs target
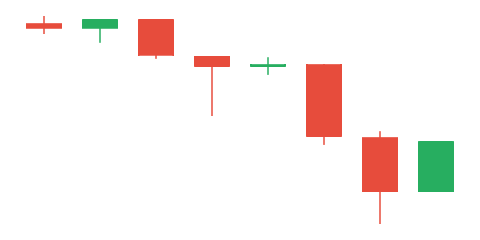
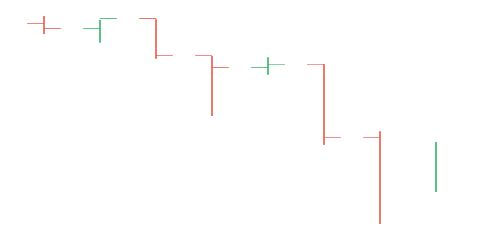
Finance

Polar
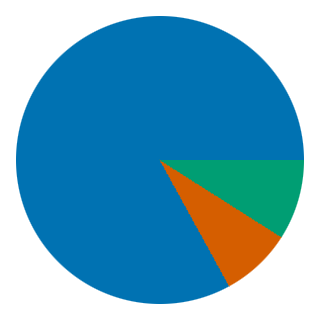
Pie / donut
Categorical proportions

Sunburst
Radial hierarchy

Radar
Multi-axis polygon overlay

Polar plot
Wind-rose / angular sectors
Heatmaps
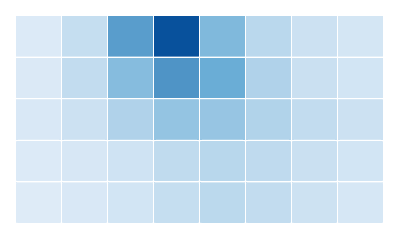
Table heatmap
2D matrix as colour grid

Calendar heatmap
Year-in-review 7×52 grid
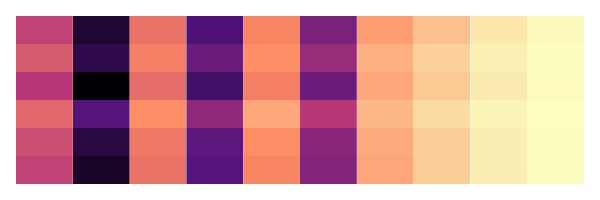
Lasagna plot
Entity-time stripes
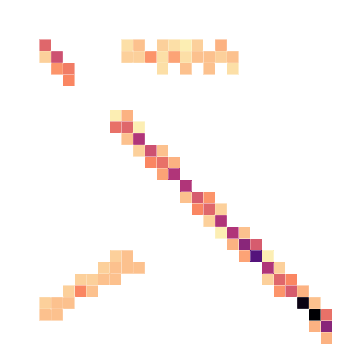
2D histogram
Binned point-cloud density
Topology + multi-view
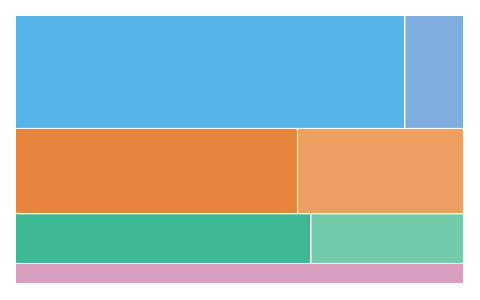
Treemap
Nested rectangle hierarchy
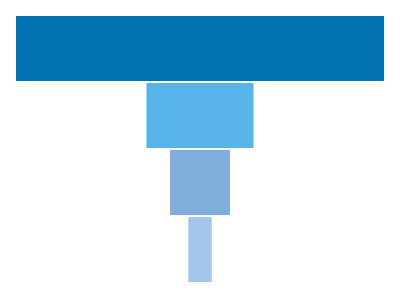
Funnel
Staged conversion bands
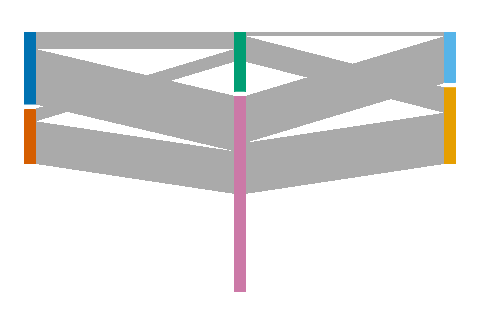
Sankey
Column-based flow ribbons
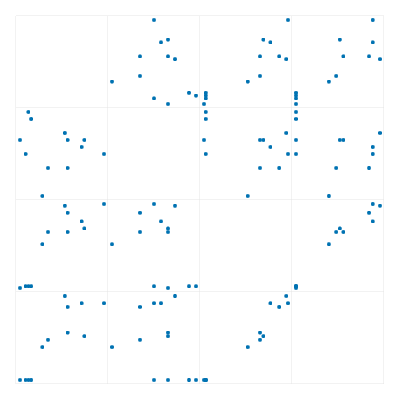
SPLOM
Pairwise scatter matrix
Distributions
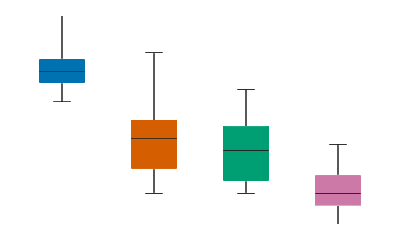
Box plot
5-number summary per category
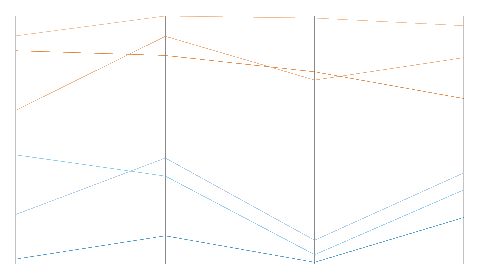
Parallel coordinates
N axes polyline overlay
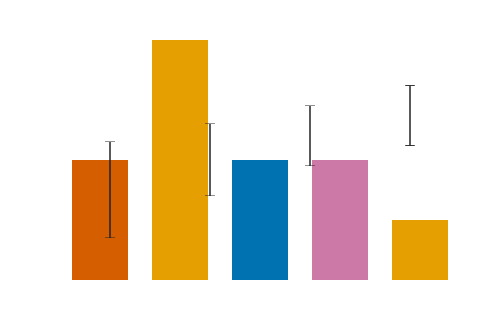
Error bars
Uncertainty whiskers on bar / point / line
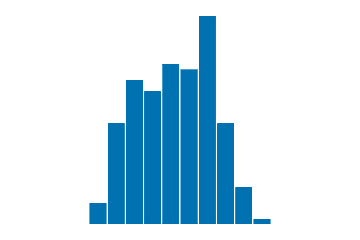
Histogram
Equal-width sample bins
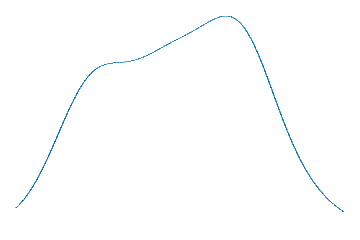
Density (KDE)
Smoothed 1D density estimate
Faceted density
One KDE per facet via trellis